
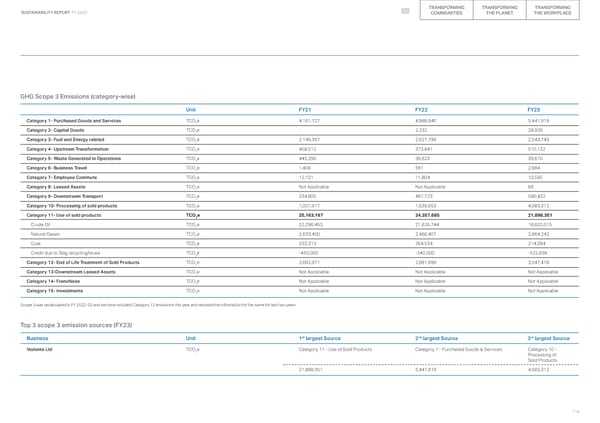
TRANSFORMING TRANSFORMING TRANSFORMING SUSTAINABILITY REPORT FY 2023 COMMUNITIES THE PLANET THE WORKPLACE GHG Scope 3 Emissions (category-wise) Unit FY21 FY22 FY23 Category 1- Purchased Goods and Services TCO2e 4,161,727 4,988,940 5,441,919 Category 2- Capital Goods TCO2e - 2,232 28,929 Category 3- Fuel and Energy related TCO2e 2,146,367 2,627,796 2,543,743 Category 4- Upstream Transformation TCO2e 458,512 373,841 510,132 Category 5- Waste Generated in Operations TCO2e 445,290 38,623 39,610 Category 6- Business Travel TCO2e 1,406 591 2,984 Category 7- Employee Commute TCO2e 12,101 11,804 10,595 Category 8- Leased Assets TCO2e Not Applicable Not Applicable 66 Category 9- Downstream Transport TCO2e 234,805 487,723 580,432 Category 10- Processing of sold products TCO2e 1,001,617 1,639,653 4,083,312 Category 11- Use of sold products TCO2e 25,163,167 24,357,685 21,898,351 Crude Oil TCO2e 22,296,453 21,626,744 18,820,015 Natural Gases TCO2e 2,633,400 2,466,407 2,864,242 Coal TCO2e 233,313 264,534 214,094 Credit due to Slag recycling/reuse TCO2e -430,000 -340,000 -522,839 Category 12- End of Life Treatment of Sold Products TCO2e 2,692,971 2,881,698 3,047,478 Category 13-Downstream Leased Assets TCO2e Not Applicable Not Applicable Not Applicable Category 14- Franchises TCO2e Not Applicable Not Applicable Not Applicable Category 15- Investments TCO2e Not Applicable Not Applicable Not Applicable Scope 3 was recalculated in FY 2022-23 and we have included Category 12 emissions this year and restated the information for the same for last two years Top 3 scope 3 emission sources (FY23) st nd rd Business Unit 1 largest Source 2 largest Source 3 largest Source Vedanta Ltd TCO2e Category 11 - Use of Sold Products Category 1 - Purchased Goods & Services Category 10 - Processing of Sold Products 21,898,351 5,441,919 4,083,312 119
 2023 ESG Report Page 118 Page 120