
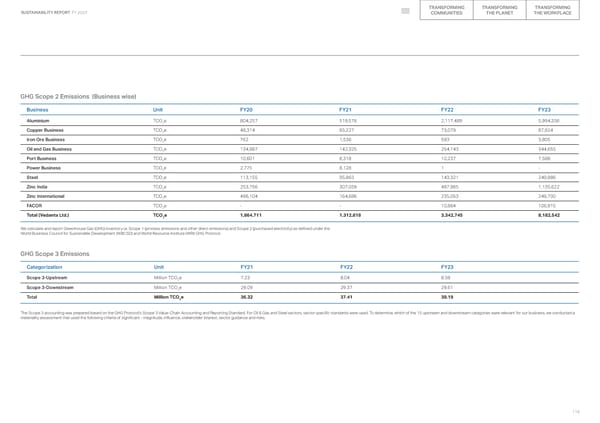
TRANSFORMING TRANSFORMING TRANSFORMING SUSTAINABILITY REPORT FY 2023 COMMUNITIES THE PLANET THE WORKPLACE GHG Scope 2 Emissions (Business wise) Business Unit FY20 FY21 FY22 FY23 Aluminium TCO2e 804,257 519,576 2,117,489 5,994,336 Copper Business TCO2e 48,314 65,227 73,079 87,924 Iron Ore Business TCO2e 762 1,536 593 3,805 Oil and Gas Business TCO2e 134,987 142,325 254,143 344,655 Port Business TCO2e 10,601 8,318 10,237 7,588 Power Business TCO2e 2,775 8,128 1 - Steel TCO2e 113,155 95,963 143,321 249,986 Zinc India TCO2e 253,756 307,059 497,965 1,135,622 Zinc International TCO2e 496,104 164,686 235,053 249,700 FACOR TCO2e - - 10,864 106,915 Total (Vedanta Ltd.) TCO2e 1,864,711 1,312,818 3,342,745 8,182,542 We calculate and report Greenhouse Gas (GHG) inventory i.e. Scope 1 (process emissions and other direct emissions) and Scope 2 (purchased electricity) as defined under the World Business Council for Sustainable Development (WBCSD) and World Resource Institute (WRI) GHG Protocol. GHG Scope 3 Emissions Categorization Unit FY21 FY22 FY23 Scope 3-Upstream Million TCO2e 7.23 8.04 8.58 Scope 3-Downstream Million TCO2e 29.09 29.37 29.61 Total Million TCO e 36.32 37.41 38.19 2 The Scope 3 accounting was prepared based on the GHG Protocol’s Scope 3 Value-Chain Accounting and Reporting Standard. For Oil & Gas and Steel sectors, sector specific standards were used. To determine, which of the 15 upstream and downstream categories were relevant for our business, we conducted a materiality assessment that used the following criteria of significant - magnitude, influence, stakeholder interest, sector guidance and risks. 118
 2023 ESG Report Page 117 Page 119