
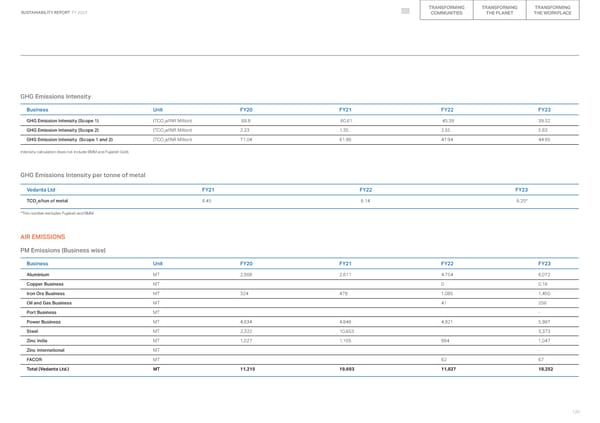
TRANSFORMING TRANSFORMING TRANSFORMING SUSTAINABILITY REPORT FY 2023 COMMUNITIES THE PLANET THE WORKPLACE GHG Emissions Intensity Business Unit FY20 FY21 FY22 FY23 GHG Emission Intensity (Scope 1) (TCO2e/INR Million) 68.8 60.61 45.39 39.32 GHG Emission Intensity (Scope 2) (TCO2e/INR Million) 2.23 1.35 2.55 5.63 GHG Emission Intensity (Scope 1 and 2) (TCO2e/INR Million) 71.04 61.96 47.94 44.95 Intensity calculation does not include BMM and Fujairah Gold. GHG Emissions Intensity per tonne of metal Vedanta Ltd FY21 FY22 FY23 TCO2e/ton of metal 6.45 6.14 6.25* *This number excludes Fujairah and BMM AIR EMISSIONS PM Emissions (Business wise) Business Unit FY20 FY21 FY22 FY23 Aluminium MT 2,908 2,611 4,754 6,072 Copper Business MT 0 0.16 Iron Ore Business MT 324 478 1,085 1,450 Oil and Gas Business MT 41 256 Port Business MT - Power Business MT 4,634 4,846 4,921 5,987 Steel MT 2,322 10,653 3,373 Zinc India MT 1,027 1,105 964 1,047 Zinc International MT - FACOR MT 62 67 Total (Vedanta Ltd.) MT 11,215 19,693 11,827 18,252 120
 2023 ESG Report Page 119 Page 121