
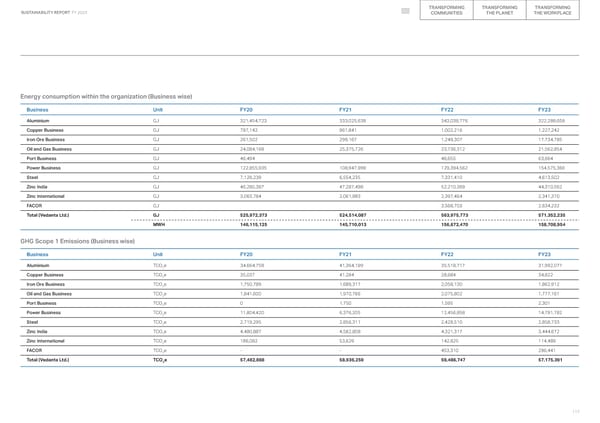
TRANSFORMING TRANSFORMING TRANSFORMING SUSTAINABILITY REPORT FY 2023 COMMUNITIES THE PLANET THE WORKPLACE Energy consumption within the organization (Business wise) Business Unit FY20 FY21 FY22 FY23 Aluminium GJ 321,454,723 333,025,639 343,038,776 322,288,658 Copper Business GJ 797,142 961,841 1,002,216 1,227,242 Iron Ore Business GJ 261,502 299,167 1,249,307 17,734,785 Oil and Gas Business GJ 24,084,168 25,375,726 23,736,312 21,562,854 Port Business GJ 46,494 46,655 63,664 Power Business GJ 122,855,935 108,947,999 129,394,562 154,575,366 Steel GJ 7,128,238 6,554,235 7,331,410 4,613,502 Zinc India GJ 46,280,387 47,287,498 52,210,369 44,310,562 Zinc International GJ 3,063,784 2,061,983 2,397,464 2,341,370 FACOR GJ 3,568,703 2,634,232 Total (Vedanta Ltd.) GJ 525,972,373 524,514,087 563,975,773 571,352,235 MWH 146,115,125 145,710,013 156,672,470 158,708,954 GHG Scope 1 Emissions (Business wise) Business Unit FY20 FY21 FY22 FY23 Aluminium TCO2e 34,664,758 41,364,189 35,518,717 31,992,077 Copper Business TCO2e 35,037 41,284 28,684 34,822 Iron Ore Business TCO2e 1,750,789 1,689,317 2,058,130 1,862,912 Oil and Gas Business TCO2e 1,841,600 1,970,766 2,075,802 1,777,161 Port Business TCO2e 0 1,750 1,595 2,301 Power Business TCO2e 11,804,420 6,376,205 12,456,858 14,791,782 Steel TCO2e 2,719,295 2,856,311 2,429,510 2,858,733 Zinc India TCO2e 4,480,887 4,582,808 4,321,317 3,444,672 Zinc International TCO2e 186,082 53,629 142,825 114,489 FACOR TCO2e - - 453,310 296,441 Total (Vedanta Ltd.) TCO2e 57,482,868 58,936,259 59,486,747 57,175,391 117
 2023 ESG Report Page 116 Page 118