
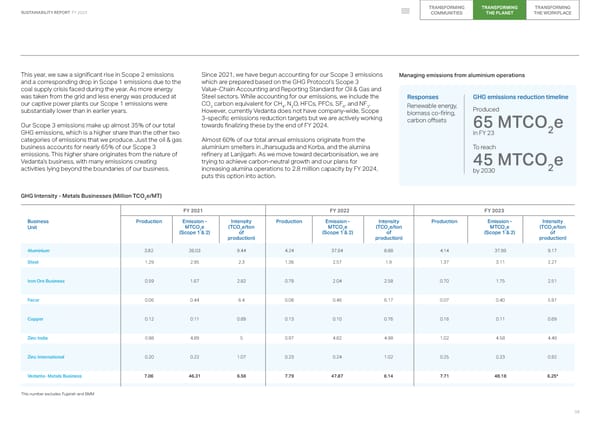
TRANSFORMING TRANSFORMING TRANSFORMING SUSTAINABILITY REPORT FY 2023 COMMUNITIES THE PLANET THE WORKPLACE This year, we saw a significant rise in Scope 2 emissions Since 2021, we have begun accounting for our Scope 3 emissions Managing emissions from aluminium operations and a corresponding drop in Scope 1 emissions due to the which are prepared based on the GHG Protocol’s Scope 3 coal supply crisis faced during the year. As more energy Value-Chain Accounting and Reporting Standard for Oil & Gas and was taken from the grid and less energy was produced at Steel sectors. While accounting for our emissions, we include the Responses GHG emissions reduction timeline our captive power plants our Scope 1 emissions were CO carbon equivalent for CH , N O, HFCs, PFCs, SF , and NF . 2 4 2 6 3 Renewable energy, Produced substantially lower than in earlier years. However, currently Vedanta does not have company-wide, Scope biomass co-firing, 3-specific emissions reduction targets but we are actively working carbon offsets Our Scope 3 emissions make up almost 35% of our total towards finalizing these by the end of FY 2024. 65 MTCO e 2 GHG emissions, which is a higher share than the other two in FY 23 categories of emissions that we produce. Just the oil & gas Almost 60% of our total annual emissions originate from the business accounts for nearly 65% of our Scope 3 aluminium smelters in Jharsuguda and Korba, and the alumina To reach emissions. This higher share originates from the nature of refinery at Lanjigarh. As we move toward decarbonisation, we are Vedanta’s business, with many emissions creating trying to achieve carbon-neutral growth and our plans for 45 MTCO e activities lying beyond the boundaries of our business. increasing alumina operations to 2.8 million capacity by FY 2024, by 2030 2 puts this option into action. GHG Intensity - Metals Businesses (Million TCO e/MT) 2 FY 2021 FY 2022 FY 2023 Business Production Emission - Intensity Production Emission - Intensity Production Emission - Intensity Unit MTCOe (TCO e/ton MTCOe (TCO e/ton MTCOe (TCO e/ton 2 2 2 2 2 2 (Scope 1 & 2) of (Scope 1 & 2) of (Scope 1 & 2) of production) production) production) Aluminium 3.82 36.03 9.44 4.24 37.64 8.88 4.14 37.99 9.17 Steel 1.29 2.95 2.3 1.36 2.57 1.9 1.37 3.11 2.27 Iron Ore Business 0.59 1.67 2.82 0.79 2.04 2.58 0.70 1.75 2.51 Facor 0.06 0.44 6.4 0.08 0.46 6.17 0.07 0.40 5.97 Copper 0.12 0.11 0.89 0.13 0.10 0.76 0.16 0.11 0.69 Zinc India 0.98 4.89 5 0.97 4.82 4.98 1.02 4.58 4.49 Zinc International 0.20 0.22 1.07 0.23 0.24 1.02 0.25 0.23 0.92 Vedanta- Metals Business 7.06 46.31 6.56 7.79 47.87 6.14 7.71 48.18 6.25* This number excludes Fujairah and BMM 58
 2023 ESG Report Page 57 Page 59