
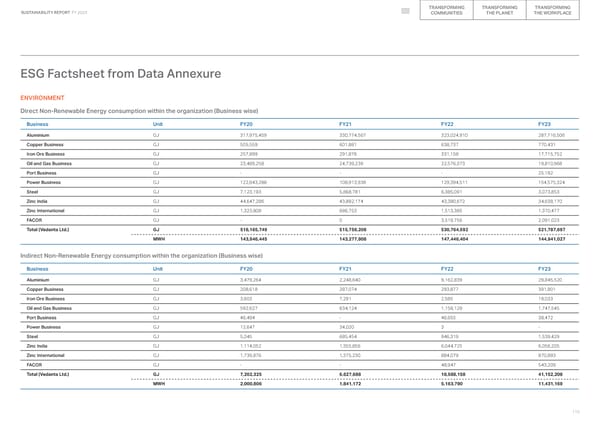
TRANSFORMING TRANSFORMING TRANSFORMING SUSTAINABILITY REPORT FY 2023 COMMUNITIES THE PLANET THE WORKPLACE ESG Factsheet from Data Annexure ENVIRONMENT Direct Non-Renewable Energy consumption within the organization (Business wise) Business Unit FY20 FY21 FY22 FY23 Aluminium GJ 317,975,459 330,774,567 323,024,910 287,716,506 Copper Business GJ 505,559 601,881 638,737 770,431 Iron Ore Business GJ 257,899 291,876 331,158 17,715,752 Oil and Gas Business GJ 23,489,258 24,739,239 22,576,373 19,810,968 Port Business GJ - - - 25,192 Power Business GJ 122,843,288 108,913,938 129,394,511 154,575,324 Steel GJ 7,123,193 5,868,781 6,385,091 3,073,853 Zinc India GJ 44,647,286 43,882,174 43,380,672 34,638,170 Zinc International GJ 1,323,808 686,753 1,513,385 1,370,477 FACOR GJ - 0 3,519,756 2,091,023 Total (Vedanta Ltd.) GJ 518,165,749 515,759,208 530,764,592 521,787,697 MWH 143,946,445 143,277,908 147,446,404 144,941,027 Indirect Non-Renewable Energy consumption within the organization (Business wise) Business Unit FY20 FY21 FY22 FY23 Aluminium GJ 3,479,264 2,248,640 9,162,839 29,845,520 Copper Business GJ 208,618 287,074 293,877 391,901 Iron Ore Business GJ 3,603 7,291 2,585 19,033 Oil and Gas Business GJ 592,627 634,124 1,158,129 1,747,545 Port Business GJ 46,494 - 46,655 38,472 Power Business GJ 12,647 34,020 3 - Steel GJ 5,045 685,454 946,319 1,539,429 Zinc India GJ 1,114,052 1,355,856 6,044,725 6,056,205 Zinc International GJ 1,739,976 1,375,230 884,079 970,893 FACOR GJ - - 48,947 543,209 Total (Vedanta Ltd.) GJ 7,202,325 6,627,688 18,588,158 41,152,208 MWH 2,000,806 1,841,172 5,163,790 11,431,169 115
 2023 ESG Report Page 114 Page 116