
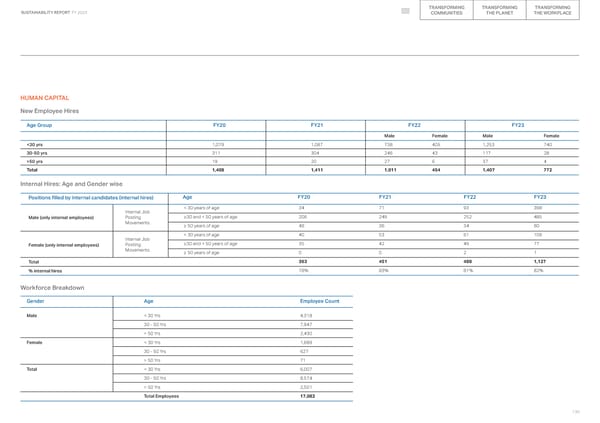
TRANSFORMING TRANSFORMING TRANSFORMING SUSTAINABILITY REPORT FY 2023 COMMUNITIES THE PLANET THE WORKPLACE HUMAN CAPITAL New Employee Hires Age Group FY20 FY21 FY22 FY23 Male Female Male Female 50 yrs 19 20 27 6 37 4 Total 1,409 1,411 1,011 454 1,407 772 Internal Hires: Age and Gender wise Positions filled by internal candidates (internal hires) Age FY20 FY21 FY22 FY23 < 30 years of age 34 71 93 398 Internal Job Male (only internal employees) Posting ≥30 and < 50 years of age 206 249 252 485 Movements ≥ 50 years of age 48 36 34 60 < 30 years of age 40 53 61 106 Internal Job Female (only internal employees) Posting ≥30 and < 50 years of age 35 42 46 77 Movements ≥ 50 years of age 0 0 2 1 Total 363 451 488 1,127 % internal hires 78% 83% 81% 82% Workforce Breakdown Gender Age Employee Count Male < 30 Yrs 4,318 30 - 50 Yrs 7,947 > 50 Yrs 2,430 Female < 30 Yrs 1,689 30 - 50 Yrs 627 > 50 Yrs 71 Total < 30 Yrs 6,007 30 - 50 Yrs 8,574 > 50 Yrs 2,501 Total Employees 17,082 130
 2023 ESG Report Page 129 Page 131