
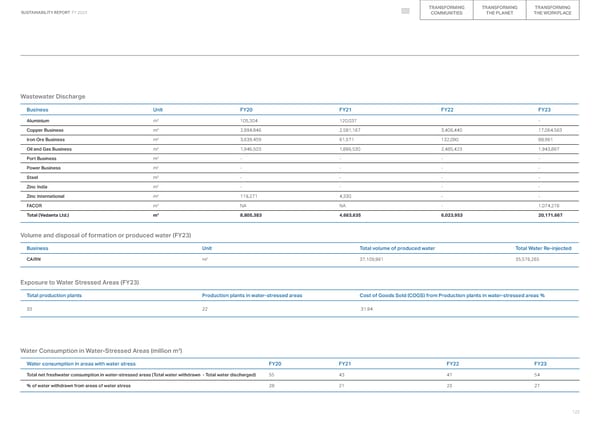
TRANSFORMING TRANSFORMING TRANSFORMING SUSTAINABILITY REPORT FY 2023 COMMUNITIES THE PLANET THE WORKPLACE Wastewater Discharge Business Unit FY20 FY21 FY22 FY23 Aluminium m3 105,304 120,037 - Copper Business m3 2,994,846 2,581,167 3,406,440 17,064,563 Iron Ore Business m3 3,639,459 61,571 132,090 88,961 Oil and Gas Business m3 1,946,503 1,896,530 2,485,423 1,943,867 Port Business m3 - - - - Power Business m3 - - - - Steel m3 - - - - Zinc India m3 - - - - Zinc International m3 119,271 4,330 - - FACOR m3 NA NA - 1,074,276 3 8,805,383 4,663,635 6,023,953 20,171,667 Total (Vedanta Ltd.) m Volume and disposal of formation or produced water (FY23) Business Unit Total volume of produced water Total Water Re-injected CAIRN m3 37,109,961 35,576,265 Exposure to Water Stressed Areas (FY23) Total production plants Production plants in water-stressed areas Cost of Goods Sold (COGS) from Production plants in water-stressed areas % 33 22 31.94 3 Water Consumption in Water-Stressed Areas (million m ) Water consumption in areas with water stress FY20 FY21 FY22 FY23 Total net freshwater consumption in water-stressed areas (Total water withdrawn - Total water discharged) 55 43 47 54 % of water withdrawn from areas of water stress 28 21 23 27 122
 2023 ESG Report Page 121 Page 123